Reporting
The 'My Reports' Page
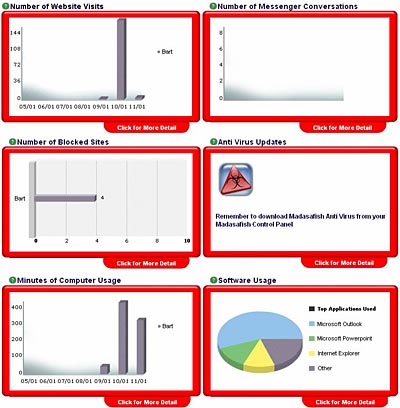
Parental Control provides reports for each machine that it is installed on. These are shown on the My Reports page, which you will see whenever you login to your Parental Control Centre. This page shows summarised activity for all active users.
The 6 graphs displayed show the total activity for all users on this computer. For detailed drill down reports click on the More Detail tab.
Using the Summary Report Screens
You can get more detail on the area covered by each report by clicking on the Click for More Detail tab at the bottom right of each summary report.
Website Visit Reports
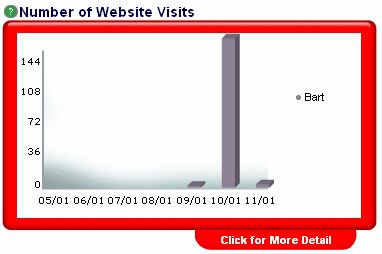
Parental Control monitors which websites are visited, and how much time is spent for each active user. The summary graph on the My Reports page shows how many websites have been visited by each user.
Clicking on the tab labelled Click for More Detail will display the screen below. This report reflects the number of websites that each user of this computer visited on a particular day.
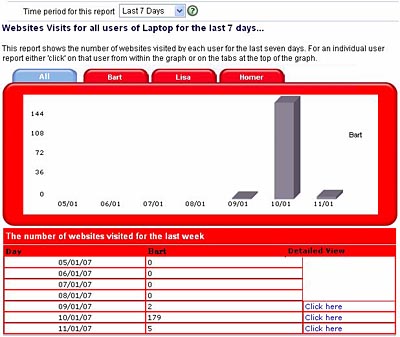
The report for a single user can also be shown by clicking on the user's tab at the top of the graph.
If you are viewing a summary report click on Detailed View to bring up a new report that will show you all the user's Internet activity for that particular day.
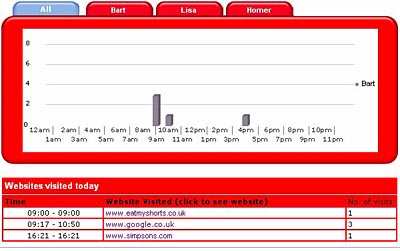
You can click on the web address listed in the table to review a history of previously visited websites.
You can use the calendar, which appears at the bottom left hand corner beneath the navigation controls to view a report for a specific day.
Blocked Website Visits Reports
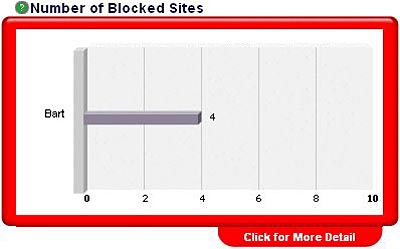
Parental Control records any attempt made by a user to access a website which you have chosen to block. This is visible in the summary graph of My Reports page.
The Click for more Detail button displays an indepth summary.
Messenger/Chat Monitoring Reports
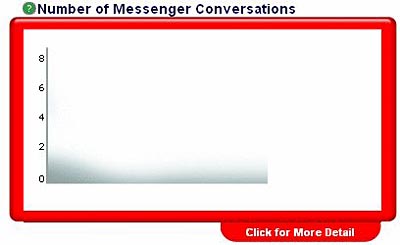
Parental Control records all Instant Messenger applications (MSN®, Yahoo®, AOL® and ICQ®) conversations. You can see a summary of the amount of time spent using these applications, and also view the content of the conversations.
The summary graph shows how many minutes were spent on these applications by each user, for each of the past seven days
The Click for more Detail button displays an indepth summary.
Software Usage Reports
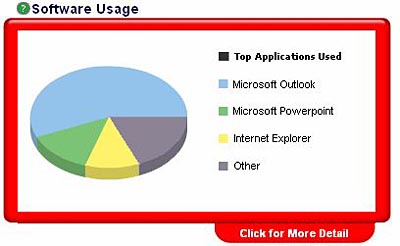
The summary graph shows which applications were most used.
The Click for more Detail button displays an indepth summary.
Active time is measured by use of the keyboard and/or mouse. An application will be considered inactive after being dormant for 2 minutes, even though it may not have been closed completely.
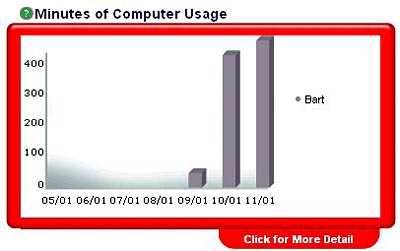
Computer Usage Reports
The summary graph shows the usage of each user per computer (in minutes) over the last seven days.
The Click for more Detail button displays an indepth summary.
Has this page helped you solve your problem? Your feedback helps us to improve the help we provide.
Rate this page : 


Please note: We cannot reply to individual feedback through Rate My Page. If you need more help with a problem please use Contact Us.
People who read this article also found these useful:
Introduction to Madasafish Parental Control


